

Fig.1 OVA induced asthma model in BALB/c mice.(A) Body weight (B) Body weight change. (*P<0.05, **P<0.01 Vs Group2)

Fig.2 OVA induced asthma model in BALB/c mice.(A) Inflammatory cell number in BALF. (B) Eosinophils in BALF. (C) Eosinophils percentage in inflammatory cell. (D) Serum total IgE concentration.

Fig.3 OVA induced asthma model in BALB/c mice. (A) Lung H&E and PAS stain(B) Inflammatory cell infiltration score (C) Bronchial score.


Fig.1 Body weight of HDM induced hIL4/hIL4R mice asthma model (n=6, Data are presented as Mean and ± SEM).

Fig.2 HDM induced hIL4/hIL4R mice asthma model. (A) Inflammatory cell number in BALF. (B) Eosinophils in BALF. (C) Eosinophils percentage in inflammatory cell. (D) Serum total IgE concentration. (n=6, Data are presented as Mean and ± SEM.)

Fig.3 HDM induced hIL4/hIL4R mice asthma model. (A) hIL-4 mRNA expression level. (B) mIL-8 mRNA expression level. (C) mIL-13 mRNA expression level. (D) mIL-6 mRNA expression level. (E) mIL-17a mRNA expression level.

Fig.4 HDM induced hIL-4/hIL-4R mice asthma model. (A) Representative images of H&E staining. (B) Pathology score results. (n=6, Data are presented as Mean and ± SEM.) Magnification, ×5.

Fig.5 HDM induced hIL-4/hIL-4R mice asthma model. (A) Representative images of PAS staining. (B)mucus score. (n=6, Data are presented as Mean and ± SEM.) Magnification, ×10.

Fig1. HDM induced asthma in hTSLP/hTSLPR mice. (A) body weight (B) body weight change

Fig 2. HDM induced asthma in hTSLP/hTSLPR mice. (A) serum mIgE (B) serum HDM mIgE

Fig3. HDM induced asthma in hTSLP/hTSLPR mice. (A) BALF mCD45 events (B) BALF Eos events (C) BALF Eos%/mCD45

Fig4. HDM induced asthma in hTSLP/hTSLPR mice. (A) pathology score (B) Representative photographs of H&E and PAS -stained lung sections

Fig 1. Body weight monitoring in an HDM-induced asthma model in C57BL/6 mice. (A) Body weight over time. (B) Percentage change in body weight relative to baseline.

Fig 2. The efficacy of DEX on the HDM-induced asthma model in C57BL/6 mice. (A) Absolute number of eosinophils in BALF. (B) Percentage of eosinophils relative to total inflammatory cells. (C) Total serum IgE concentration.

Fig 1. Analysis of inflammatory cell populations in BALF. Flow cytometric quantification of inflammatory cells in BALF. (A) Percentage of macrophages. (B) Percentage of eosinophils. (C) Percentage of lymphocytes.

Fig 2. The efficacy Dupilumab and Tezepelumab on OVA+hTSLP-induced asthma model in hIL4/hIL4R/hTSLP/hCRLF2 mice. (A) Concentration of total serum IgE. (B) Concentration of OVA-specific serum IgE. (C) Relative mRNA expression of mCCL17 in lung tissue. (D) Relative mRNA expression of hIL-4 in lung tissue.

Fig 3. Comprehensive histopathological assessment of lung injury.

Fig 4. Comprehensive histopathological assessment of lung injury. (A) Inflammatory cell infiltration Score. (B) Eosinophil cell infiltration Score. (C) Bronchial Goblet Cell Hyperplasia Score. (D) Airway Basement Membrane Thickening Score. (E) Total Lung Injury Score. (F) PAS Staining Score.

Fig 1. The efficacy of Itepekimab and Tezepelumab on OVA+hTSLP+hIL33-induced asthma model in hIL33/hTSLP/hCRLF2 mice. Mice were challenged with OVA and hTSLP+hIL33 and treated with Itepekimab, Tezepelumab, or a combination. (A) Body weight over time. (B) Percentage change in body weight relative to baseline.

Fig 2. Analysis of inflammatory cell populations in BALF. Flow cytometric quantification of inflammatory cells in BALF. (A) Total inflammatory cell count in BALF. (B) Percentage of lymphocytes among total inflammatory cells. (C) Absolute lymphocytes count in BALF.

Fig 3. Analysis of inflammatory cell populations in BALF. Flow cytometric quantification of inflammatory cells in BALF. (A) Percentage of eosinophils among total inflammatory cells. (B) Absolute eosinophils count in BALF. (C) Percentage of neutrophils among total inflammatory cells. (D) Absolute neutrophils count in BALF.

Fig 4. Analysis of inflammatory cell populations in BALF. Flow cytometric quantification of inflammatory cells in BALF. (A) Percentage of macrophage among total inflammatory cells. (B) Absolute macrophage count in BALF. (C) Percentage of DC cell among total inflammatory cells. (D) Absolute DC cell count in BALF.

Fig 5. The efficacy of Itepekimab and Tezepelumab on OVA+hTSLP+hIL33-induced asthma model in hIL33/hTSLP/hCRLF2 mice. (A) Concentration of total serum IgE.
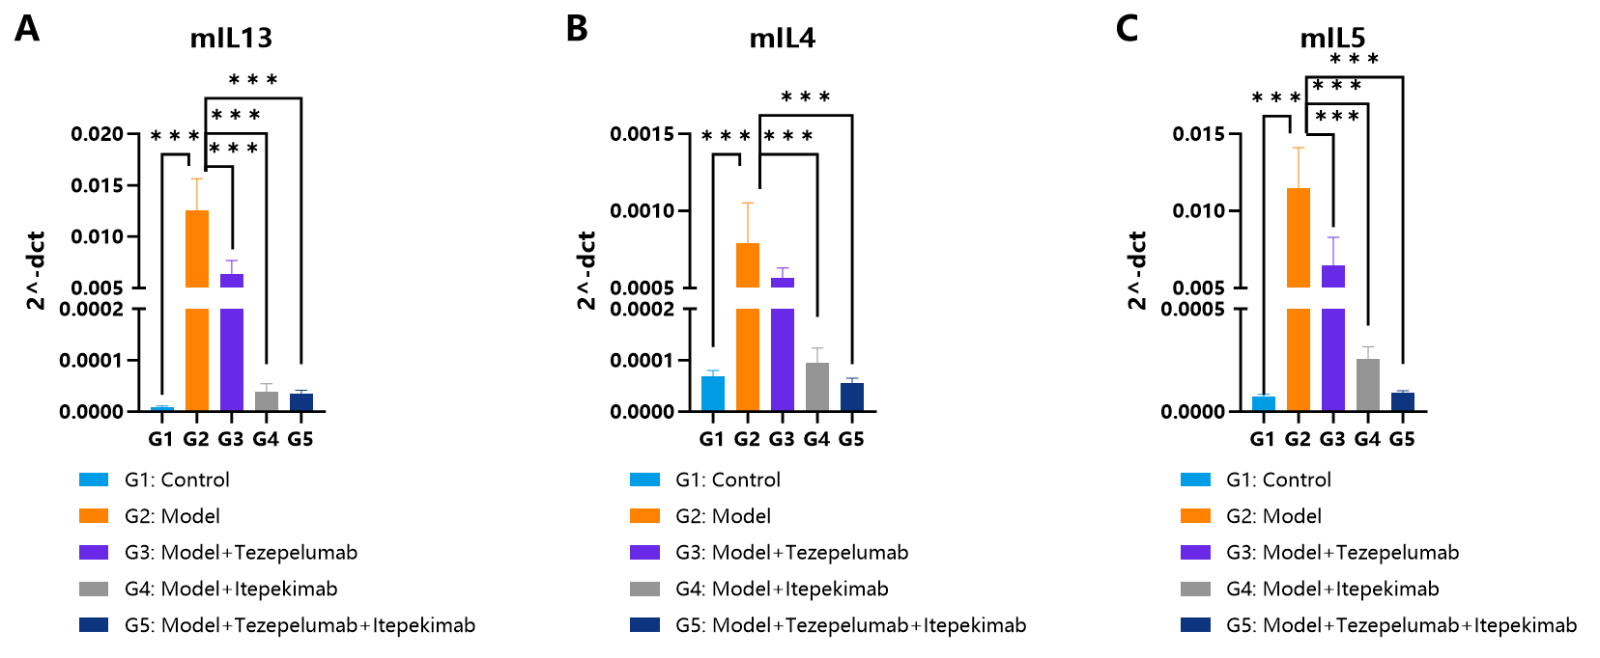
Fig 6. The efficacy of Itepekimab and Tezepelumab on OVA+hTSLP+hIL33-induced asthma model in hIL33/hTSLP/hCRLF2 mice. (A) Relative mRNA expression of mIL-13 in lung tissue. (B) Relative mRNA expression of mIL-4 in lung tissue. (C) Relative mRNA expression of mIL-5 in lung tissue.
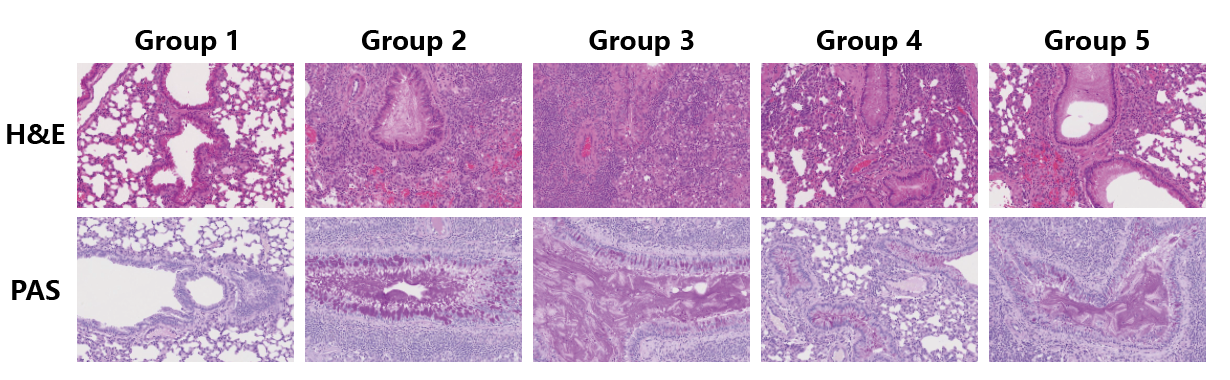
Fig 7. Comprehensive histopathological assessment of lung injury. (A) Representative photographs of H&E-stained lung sections and PAS-stained lung sections.
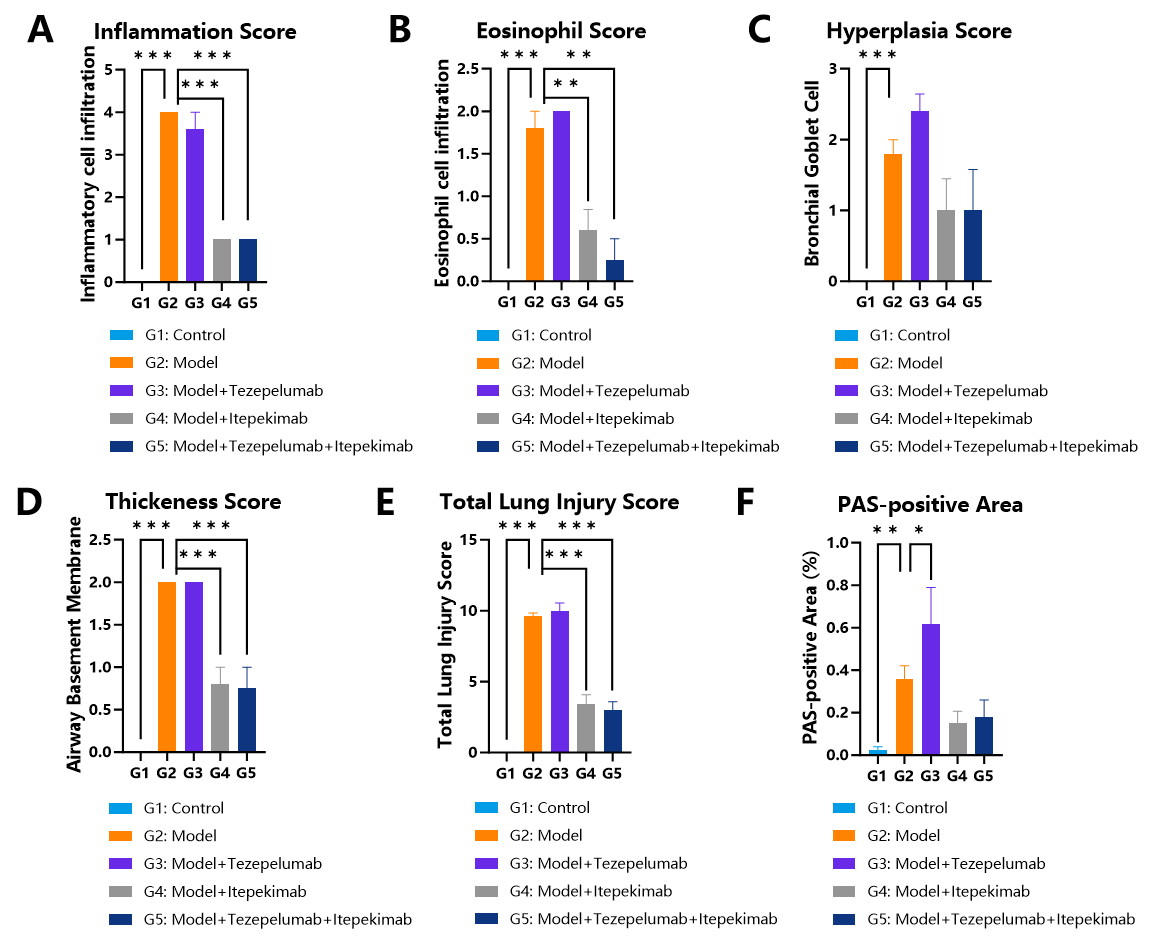
Fig 8. Comprehensive histopathological assessment of lung injury. (A) Inflammatory cell infiltration Score. (B) Eosinophil cell infiltration Score. (C) Bronchial Goblet Cell Hyperplasia Score. (D) Airway Basement Membrane Thickening Score. (E) Total Lung Injury Score. (F) PAS Staining Score.


;)